
In this blog post we will be exploring how vRealize Network Insight can be used for Day0 and Day2 kubernetes operations. Using Network Insight we can gain insights into containers traffic, security requirements, utilisation and capacity planning.
Lab Inventory
For software versions I used the following:
- VMware ESXi 7.0.2.17867351
- vCenter server version 7.0U3
- NSX-T 3.2.0.1
- vRealize Network Insight 6.6 platform and collector appliances.
- TrueNAS 12.0-U7 used to provision NFS datastores to ESXi hosts.
- VyOS 1.4 used as lab backbone router.
- Ubuntu 20.04 LTS as Linux jumpbox.
- Ubuntu 20.04.2 LTS as DNS and internet gateway.
- Windows Server 2012 R2 Datacenter as management host for UI access.
- 3 x Ubuntu 18.04 VMs as 1 x Kubernete controller and 2 x nodes.
For virtual hosts and appliances sizing I used the following specs:
- 3 x virtualised ESXi hosts each with 8 vCPUs, 4 x NICs and 32 GB RAM.
- vCenter server appliance with 2 vCPU and 24 GB RAM.
- NSX-T Manager medium appliance
- vRealize Network Insight medium Platform and Collector appliances.
- 2 x medium edges with no resource reservations.
vRealize Network Insights overview
vRealize Network Insight or vRNI is a network monitoring and analysis tool which provides users with in-depth insight into all kinds of network traffic within their data centre. Various traffic sources can be added into vRNI such NSX, physical servers, Firewalls, switches, routers, load balancers etc.
vRNI incorporates all collected data and traffic information into powerful data analysis charts and dashboards which helps users understand complex traffic patterns in the environment, along with a very powerful search function to filter on the exact information needed. The analysis can be used for security planning, resources monitoring, traffic correlation, capacity planning and of course troubleshooting.
vRNI can be purchased in either an on-prem or cloud based offering, for the on-prem version users install both vRNI platform appliance (which is the UI and analytics engine) and the collector appliances (which collects data and send it to platform appliance) locally in their data centres, while for vRNI cloud, users need to deploy only the collector appliance(s) locally in the data centre.
Installing vRNI platform and collector appliances is not a complex task and is very well documented in VMware documentation (https://docs.vmware.com/en/VMware-vRealize-Network-Insight/6.6/com.vmware.vrni.install.doc/GUID-80DA8D8B-65F0-497D-A2BA-6FAAC2A3A2B0.html) so I will not be covering this part in this blog post.
Requirements for monitoring Kubernetes clusters and containers in vRNI
In order to be able to monitor kubernetes clusters using vRNI we either need to have NCP as our cluster CNI (Cluster Network Interface) and having of course NSX-T to manage container networking and security policy configuration. In this scenario we need to add NSX Manager as data source to vRNI and pull traffic information from there.
The other method to monitor k8s cluster in vRNI is adding Antrea agents as Netflow sources, this however requires the following:
- vRNI Enterprise license (for the Netflow sources option).
- Independent collector appliance for netflow collection.
- K8s cluster with Antrea as CNI (see my previous blog posts HERE and HERE).
- Flow aggregator pod configured and in a running state.
It is important to note that when Antrea flows are collected by the flow collector and added as Netflow data sources, vRNI will treat those flows as physical flows and does not have any idea about kubernetes cluster or namespace information. If this is a requirement from your end then you will need to use NSX NCP as CNI in your kubernetes cluster and add NSX Manager as your data source.
Enabling NetFlow in Antrea and configuring flow aggregator
Step 1: Verify that all Antrea nodes and service pods are in a running state.

Step 2: Enable Netflow on Antrea agent pods
As any networking layer, if you need to collect flow information through a switch/router you need to enable that, and this is exactly what we need to do right here on the Antrea agents since they resemble our virtual switching layer for workload pods. Below is a diagram showing the interaction of Antrea agents with Flow collectors (this is from project Antrea documentation)
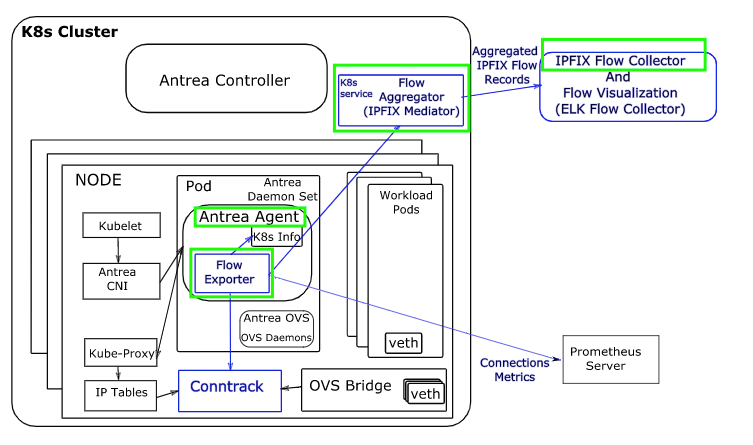
Further looking into Antrea documentation we need to set the parameter FlowExporter: true in the configmap for the agent pods shown above. For those who are new to k8s, a ConfigMap is a way of passing configuration data to containers so that they can be read if needed. We need to edit each and every configmap of the 3 Antrea agent pods shown above as follow:
- Get the configmap name for the antrea agents using the command
kubectl get configmaps -n kube-system
The highlighted configmap is the one that we need to modify, to edit this configmap use the command:
kubectl edit configmap antrea-config-f5d8g47b88 -n kube-system Set the FlowExporter parameter to true as shown below:

Save and exit the file, then we need to restart the 3 Antrea agents in order to apply the new config changes, to restart the agents you can use the command:
kubectl rollout restart ds/antrea-agent -n kube-systemNote: “ds” is a daemonset and in k8s a daemonset is a feature that lets you run a Kubernetes pod on all cluster nodes even when a new node is added to the cluster.
Ensure after the pods restart that they are all in a running state:

Step 3: Deploy and configure flow-aggregator pod
From my previous Antrea posts ( HERE and HERE) I have already downloaded VMware Antrea images and manifests and uploaded them to my k8s controller node:

The highlighted tar archive is our flow-aggregator container image and the .yml file is the manifest configuration file for the flow-aggregator pod. The flow aggregator pod is responsible for collecting flow information from Antrea agents and sending them to our vRNI NetFlow collector that we have already deployed.
In the flow-aggregator-v1.5.2+vmware.2.yml file we need to specify the following:
- Container image location of the flow aggregator.
- Configuration parameters of the flow collector (our vRNI collector appliance address and protocol).
There are different methods to load and use the flow aggregator image and specify its location in the manifest file:
- you can use the command docker load -i <image name> to load the flow-aggregator image to local repository but then you need to do this on every k8s node (controller and workers).
- Upload the flow-aggregator image to a private image repository such as Harbor (for more details on setting up and using Harbor you can reference a previous blog post I wrote HERE).
- Update the image location in the flow-aggregator manifest file to point to the public VMware repository (projects.registry.vmware.com/antrea/flow-aggregator:latest) this you can find the open Antrea project (https://raw.githubusercontent.com/antrea-io/antrea/main/build/yamls/flow-aggregator.yml)
So my manifest YAML looks like this:

Next you need to add the vRNI NetFlow collector address and protocol/port to be used for sending Flow information, int he same file update the configuration section as shown below:

I added the following section:
flowCollector:
  enable: true
  address: "192.168.50.7:2055:udp"
The port number for UDP Netflow collector can be found in vRealize Network Insight VMware documentation.
Save and exit the manifest YAML file, the next step is to apply the manifest to the k8s cluster. This can be done using the command:
kubectl apply -f flow-aggregator-v1.5.2+vmware.2.yml
In the above screenshot nothing is changed, thats because I have already applied this manifest configuration to the cluster before.
Step 4: Verify that the flow-aggregator pod is in a running state

Now, create some testing Pods (in my case above they are labeled webserver1 till webserver3 under homelab namespace). I also deployed a busybox Pod (google what busybox is to know more) to be able to generate some HTTP traffic to my 3 nginx webserver pods using wget command.

I created a while loop script below to generate http traffic and left it running for couple of hours

Verifying Containers flow information
Leave the above script running for couple of hours/days if you want, then login to your vRNI platform instance and check the captured flows under security planning, below is the result in my lab and showing http traffic from our busybox pod (10.20.0.6) to all the 3 nginx webserver pods.

Final word
Using vRNI to monitor Antrea k8s clusters can provide sysadmins with insight into their pods traffic pattern and provide helpful traffic analysis which help enormously in security and capacity planning. However, keep in mind that in this method, vRNI does not have any idea about the nature of the traffic being containers or physical servers since the collection of flow information is based on Netflow generated from Antrea agents and pushed by the flow-aggregator.

Pingback: Monitoring VMware NCP based TKGi & K8s clusters using vRNI - NSXBaas